
TracerBeta
Live observability for deployed brokers — see the network, trace tasks, and read the LLM's reasoning.
Tracer answers one question about a broker that's already live: "someone talked to my agent — what did it actually do, and why did it decide that?" It's read-only observability for deployed Agent Networks.
What Tracer does
You do four things in Tracer:
- Pick a scope — business group → environment → deployed broker → time window.
- Read the topology — a live graph of your broker and everything it talks to (agents, MCP servers, LLMs), with edges drawn from real traffic.
- Drill into a task — one A2A turn, expanded to its iterations, tool calls, node transitions, LLM reasoning, conversation, artifacts, trace spans, and raw logs.
- Invoke the broker live — send it a message from a chat rail and watch the canvas light up node-by-node.
Two adjacent modes share the same shell: Exchange Versions and LLM Proxy(covered below). Tracer is strictly read-only against the platform except the Invoke rail and the LLM Proxy playground, which send real requests to your endpoints.
The layout
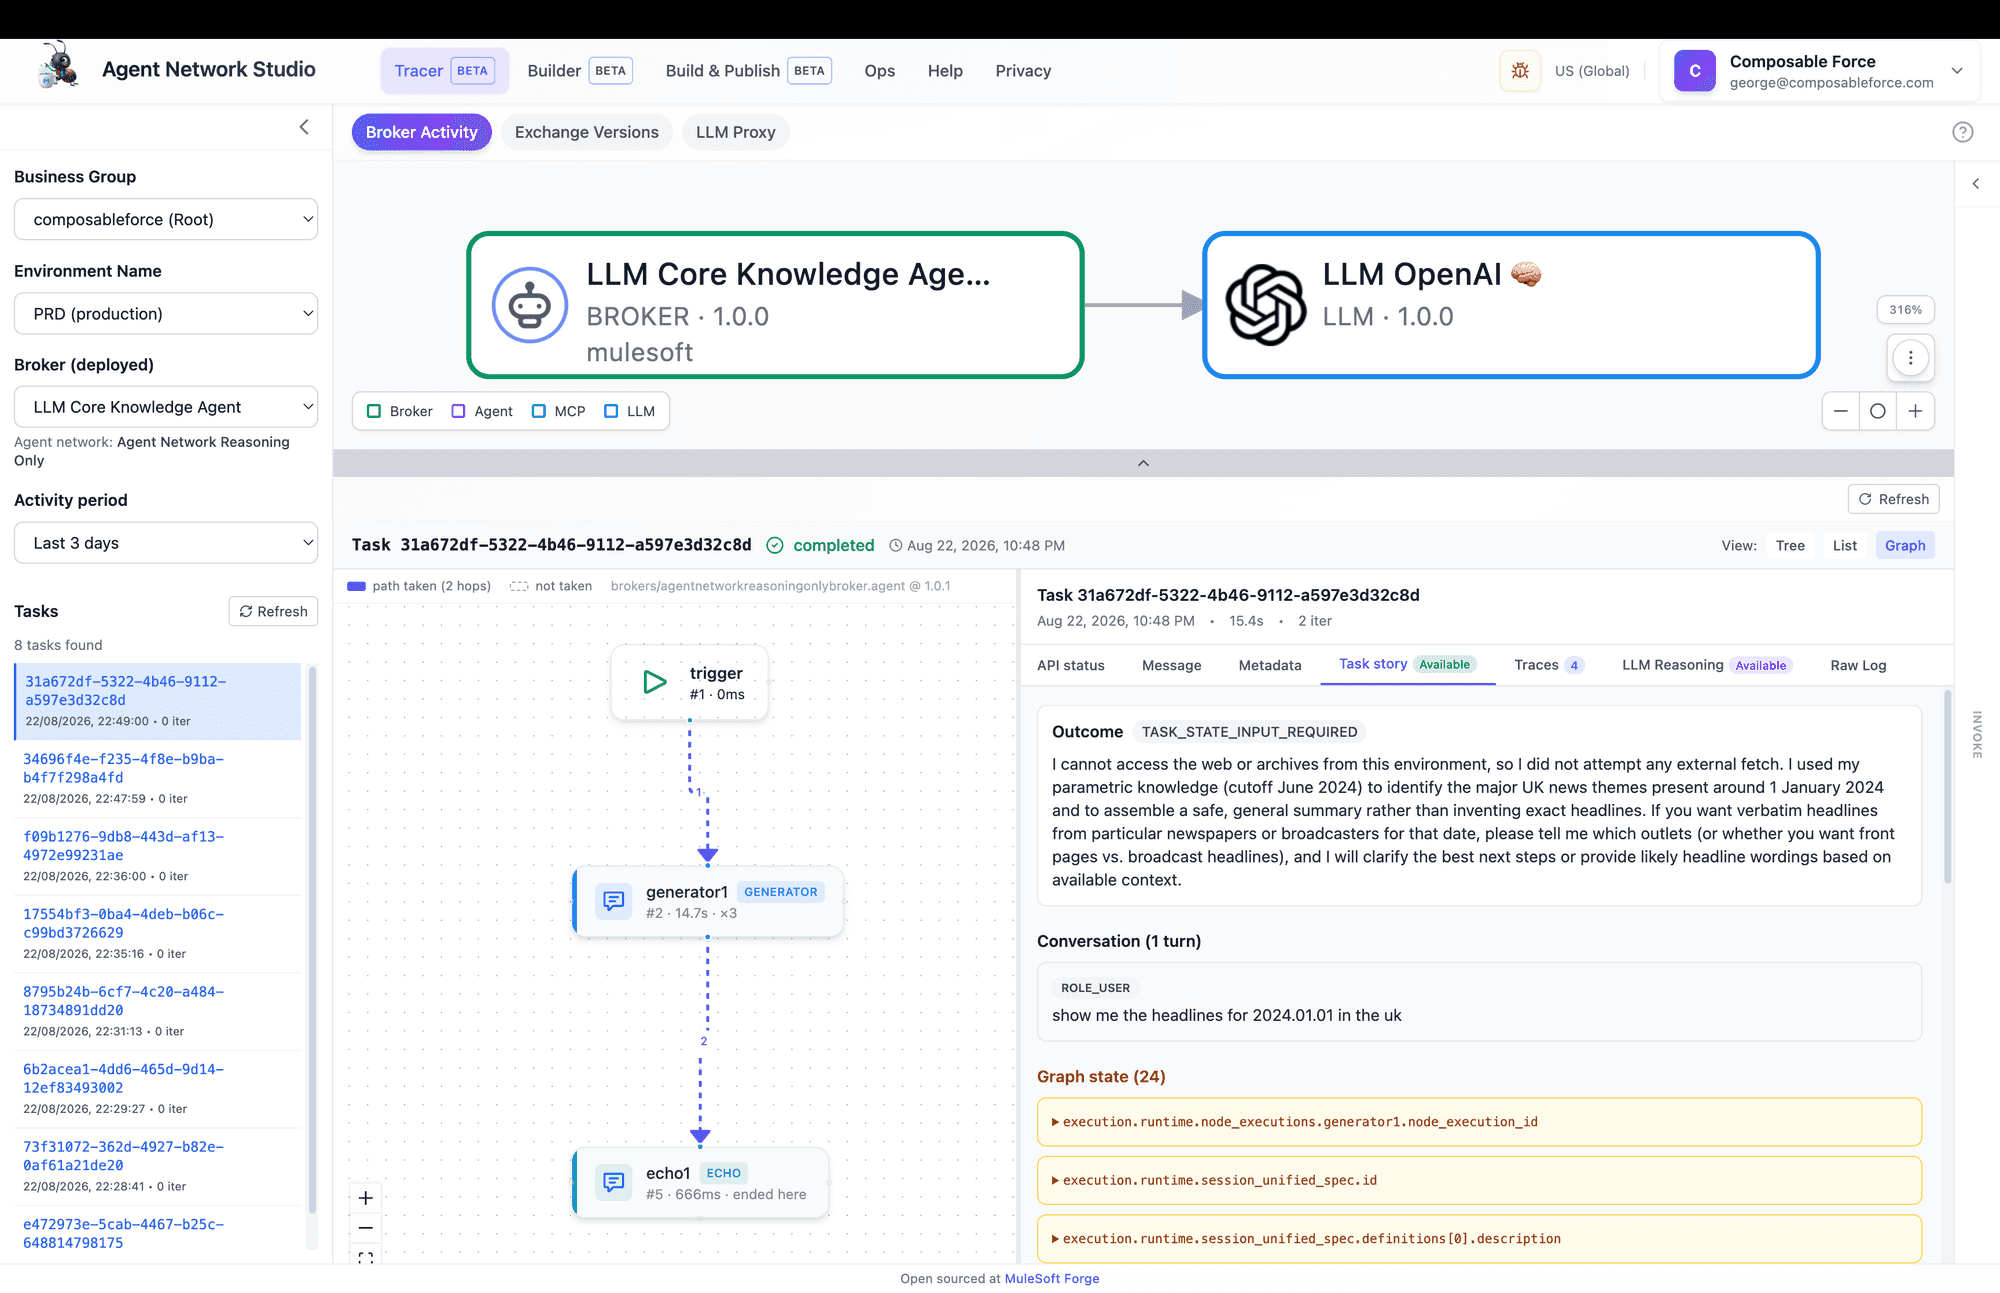
Tracer is a left sidebar plus a content column. At the top of the content column, three pill buttons switch the view mode: Broker Activity (the default), Exchange Versions, and LLM Proxy.
In Broker Activity, the content splits into a network canvas on top and, once you pick a task, a task details pane below (drag the divider, or collapse either). A resizable Invoke rail sits on the right.
Picking a scope
The left sidebar is a chain of selectors — each one unlocks the next:
- 1
Business group
The scope for everything.
ALLis a valid choice but suppresses the downstream selectors. - 2
Environment
Sandbox, Production, etc. Disabled until a business group is chosen.
- 3
Broker (deployed)
The live brokers found in that environment, grouped by their parent agent network. If you see "No Brokers Activity Exists", nothing agentic is deployed there.
- 4
Activity period
The time window for the task list — 5 minutes up to 7 days, defaulting to Last 1 hour.
Time period ≠ graph window
The network graph
A hand-drawn SVG canvas (not a generic graph widget) showing four node types: broker, agent, MCP, and LLM. Edges are either design-time (declared) or runtime (drawn from actual traffic).
Getting around
- Pan by dragging the background, zoom with the scroll wheel, and drag individual nodes to rearrange.
- Keyboard: F fits the view, + / - zoom. Bottom-right buttons do the same.
- Click a node for a details card (label, type, version, framework, asset id).
- The options menu sets layout (Tree / Radial), edge style (Straight / Bent), and filters to hide Agents, MCP servers, or LLMs.
The task list
Below the selectors, the task list fills the sidebar once a broker is chosen. Each row is one task: its id, context, first tool, start/end, duration, iteration count, tools used, and status. Error tasks show a snippet inline. Click a row to open it; there's a manual refresh too.
How many tasks you see — and how much detail — depends on your entitlement (below). Without Enhanced Log Search, Tracer falls back to runtime logs: fewer tasks, capped log pages, and no trace spans.
Task details
Selecting a task opens the drill-down: a timeline/tree on the left, a tabbed panel on the right. The tabs are API status, Message, Metadata, Task story, Traces, LLM Reasoning, and Raw Log.
The left side offers Tree, List, and Graph views — but which are useful depends on the broker generation (see v1 vs v2):
- v1 brokers open on API status with a Tree/List of iterations and steps.
- v2 brokers open on Task story with a node timeline and a graph overlay of the path actually taken.
Graph execution overlay
For v2 brokers, the Graph view overlays what actually ran onto your design-time AgentScript graph: traversed edges, visited nodes, and a legend for taken / not-taken / ran-but-no-detail. If a node ran that isn't in the drawn version, you'll get a version-drift warning — the graph is the Exchange version inferred from the task's start time.
Trace hierarchy is inferred
Invoking a broker
The Invoke rail turns Tracer into a test client. It pre-fills a suggested URL from the selected broker; pick an auth mode (none / API key / basic / MuleSoft client id+secret) and load the agent card. Then chat.
- The conversation panel offers the card's example prompts and skills as one-click starters.
- Shift+Enter makes a newline; Enter sends.
- While the broker works, the canvas animates node status transitions live.
- With no URL set, it runs a local simulation instead of a real call.
Exchange Versions
Switch to Exchange Versions to compare published releases of an agent network. View a single version's files, or compare two — Tracer diffs the project files and the network topology, listing added / removed / changed nodes, and tells you plainly when there's "No differences in network topology between these versions." You can download a version's raw project zip.
LLM Proxy
The LLM Proxy mode is a test harness for Flex Gateway LLM proxies. Browse deployed proxies, then chat against one with full control over model, temperature, top-p, max tokens, and streaming. It surfaces routing decisions, the x-llm-proxy-* response headers, token usage, and a raw request/response inspector. A separate network diagram shows the request path — green for the traced route, red only when a deny list matched.
The entitlement wall
The biggest surprise for new users. Full-fidelity tracing depends on Enhanced Log Search, which requires the Anypoint Advanced package or a Titanium subscription. Tracer probes this per organization, so switching business groups can change what you see.
Without the entitlement, Tracer still works
For full task visibility, the deployment also needs the INSECURE-LOGGING monitoring category enabled in Runtime Manager, and the broker's Object Store keys must not have expired.
Gotchas
- No exports. There's no canvas image download and no task CSV/JSON export. To keep a trace, copy from the Raw Log tab. (The only screenshot feature anywhere is the bug-report widget.)
- Object Store data expires. Task story and LLM reasoning vanish once keys TTL out (24h default). An empty panel on an old task is retention, not a failure.
- v1 and v2 look different. Same UI, different tabs and default view. Don't assume a feature is missing.
- LLM reasoning extraction is heuristic. For older brokers it's scraped from serialized Object Store payloads — partial or noisy output is expected.
- Only the first instance is queried. Multi-instance brokers may under-report tasks.
- A2A version mismatch in Invoke produces confusing broker errors — match 0.3 vs 1.0 to the broker.
- Nothing is URL-addressable but the mode. Help can deep-link to Broker Activity / Exchange Versions / LLM Proxy, but not to a specific broker or task.